ORCA MES New Update | Good/Defective Process, Sensors, Scales, and Equipment, etc.
2026.10.30
The quantity the sensor counted becomes the good items and defects of the process
Hello, owner!
Have you finished a process and pressed stop, only for the good-quantity and defect-quantity fields not to be filled with the quantity the sensor counted? Have the sensor and the scale not remained on the screen as a role showing which equipment's input or discharge they are? Has it been difficult to place the dashboard's actual results and targets side by side and compare them?
The quantity the sensor counted becomes the good items and defects of the process. Make a complex site simple, and the moment of decision fast. ORCA is a SaaS MES for manufacturing in which human hands are heavily involved, such as food, cosmetics, and pharmaceuticals. In the October 30, 2026 v4.9.4 release notes, the flow in which the quantity of a process with a photoelectric sensor attached remains as good quantity and defect quantity and is saved is placed at the center.
Key summary of this update
- Process good items and defects — On a process with a photoelectric sensor attached, when you press stop, the process good quantity and defect quantity are filled with the quantity the sensor counted. After checking, press process complete to save.
- Sensors, scales, and equipment — Register sensors and scales in Data Collection Device Management, and set the role of input detection or discharge detection on the equipment registration and edit screen.
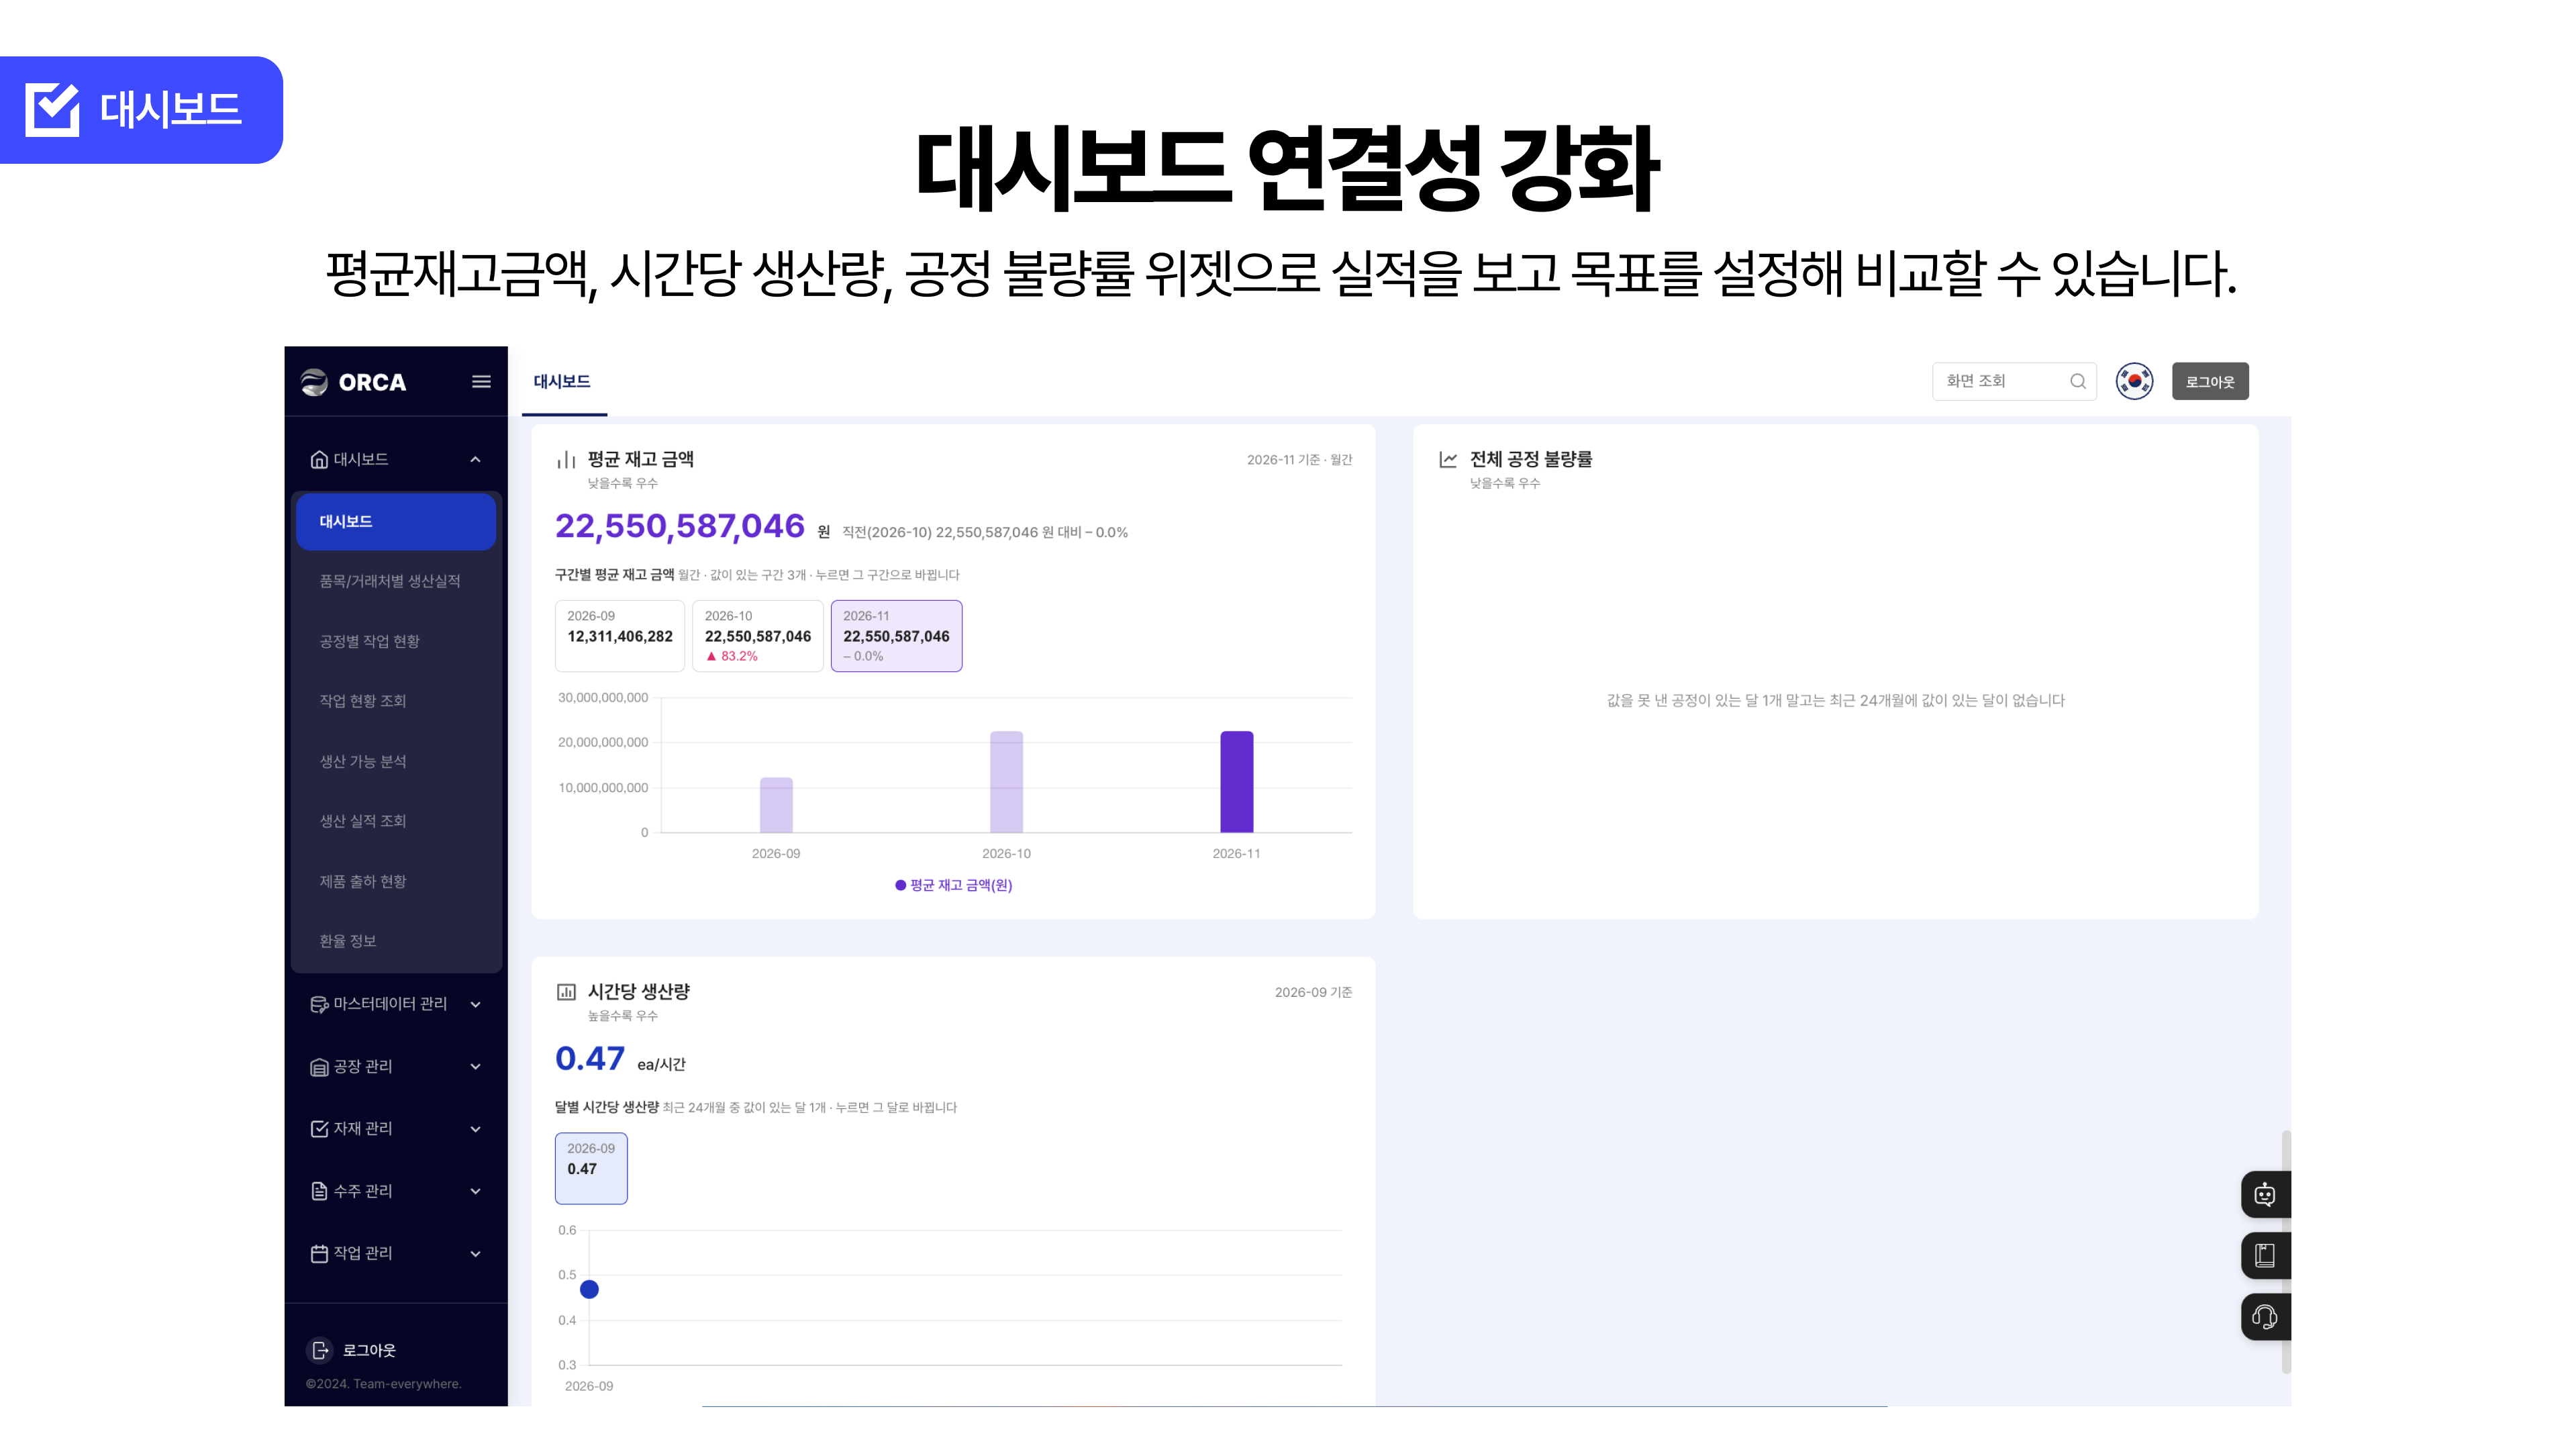
- Actual results and targets — View actual results with the dashboard widgets for average inventory amount, production quantity per hour, and process defect rate, set targets, and compare.
Understanding this ORCA update through a case
A summary alone may not make the convenience of this update strongly felt, so we prepared this. Let's take time to understand the update together through a case of a fictional company.
After this update, shall we look at what pleasant changes there were on a site that produces a main line, like OO Foods?
1. The quantity the sensor counted becomes the good items and defects of the process
On the process work screen of a process with a photoelectric sensor attached, when you press stop, the process good quantity and defect quantity are filled with the quantity the sensor counted. After checking, you can press process complete to save.
Before — Even after pressing stop, the quantity fields stayed as they were
- An on-site worker at OO Foods pressed process start on a process with a photoelectric sensor attached, finished the work, and then pressed stop. In that flow, the quantity the sensor counted was not filled into the process good quantity and defect quantity.
- If the two fields did not remain as the sensor quantity even after the work ended, it was difficult to save that process's good items and defects as the value the sensor counted.
After — When you stop, the quantities are filled, and you save after checking
- When you press stop, the quantity the sensor counted is filled into the process good quantity and defect quantity. The reason the fields are filled is that the quantity the photoelectric sensor counted goes in as that value.
- After checking the filled values, press process complete to save.
- When it is saved by process complete, that process's good quantity and defect quantity remain as the quantity the sensor counted. When the owner judges that process's actual results and defects, the basis is this saved value.
At a glance
- Before — Even if stop is pressed, the sensor quantity is not filled into the process good quantity and defect quantity
- After — Stop → good quantity and defect quantity are filled with the sensor quantity → check → save by process complete
2. Attach sensors and scales to equipment, and set their roles
Register sensors and scales in Data Collection Device Management, and view status and detection records on the device detail. On the equipment registration and edit screen, attach the device and set the role of input detection or discharge detection.
Before — The device and the equipment were not attached on the same screen
- The release notes do not tie together whether the photoelectric sensor in the previous section and the sensor spoken of here are the same device. This will be looked at separately, as the story of the staff member who registers equipment at OO Foods.
- The flow of registering sensors and scales in Data Collection Device Management, attaching an input-detection or discharge-detection role to equipment, and then viewing status and detection records on the device detail did not exist before this item existed.
- Even if there was a number, if it did not remain as a role of which equipment's input or discharge it was, it was difficult to view the device and the equipment as connected.
After — Register, attach to equipment, and set whether it is input or discharge
- Sensors and scales are registered in Data Collection Device Management. Status and detection records remain on the device detail.
- On the equipment registration screen or the equipment edit screen, attach the device to the equipment. The role is input detection or discharge detection. Whether only one of the two is chosen, or both can be set, is not in the notes, so it is not written here. Whether saving is blocked if the role is left empty is also not written.
- When input detection or discharge detection remains on the equipment registration and edit screen, the plant manager can see on that screen which role is attached to which equipment.
At a glance
- Before — There was no flow for attaching sensors and scales to equipment, setting a role, and viewing status and detection records
- After — Register in Data Collection Device Management → status and detection records on the device detail → input detection or discharge detection on equipment registration and edit
3. View actual results on the dashboard, and compare them with targets
On the dashboard, you can view actual results with the average inventory amount, production quantity per hour, and process defect rate widgets, set targets, and compare. For the process defect rate, you can choose a process and view only that process.
View the three actual results, and compare them with targets
- View actual results with the average inventory amount, production quantity per hour, and process defect rate widgets. You can set targets and compare them with those actual results.
- In the process defect rate widget, you can choose a process and view only that process's defect rate separately. This is the behavior when the plant manager narrows the view to a process.
- The owner can judge while viewing the amount tied up in inventory, production per hour, and the process defect rate together with the targets. The material for where to look first gathers as a comparison on one screen.
These parts improved together as well
- Smart scale weight graph — On the smart scale device detail, when you choose a period, the weight change for that period is shown as a graph. When you press a point on the graph, you can find that record in the table below.
- Photoelectric sensor for product inbound and outbound — On the photoelectric sensor tab of the product inbound and outbound detail, you can link a photoelectric sensor to a product and view the count trend by sensor. This is a function written separately from the good quantity and defect quantity on the process work screen.
- Equipment groups and equipment codes — If you create a group on the equipment group tab of equipment management, the equipment code is assigned by the group rule when equipment is registered. To register, you must select an equipment group and a connected process.
- Dashboard widget editing — In v4.8.6 on October 6, 2026, you can edit widgets, place them by dragging, and add or remove widgets. There are widgets for disposal, product shipment, inventory cost, and sales order count, and the period is chosen as monthly, weekly, or daily. Inventory cost is not viewed as the same widget as average inventory amount.
- Device ID — On the data collection device list, you can check the device ID of each device directly.
- Process standard detail — When you press detail in the list of linked processes, the process standard detail of that process opens in a new tab, instead of the production plan list.
- Empty lists and empty records — On a device with no linked process, the expand icon does not appear, and if there is no record in the queried period, the status history area does not appear either.
- Inspection standard registration — In the process standard search modal, you can find and select a process standard, and when you choose an inspection standard type, the inspection standard code is filled.
Frequently asked questions
Q. In a food factory, how do the process good quantity and defect quantity remain?
On a process with a photoelectric sensor attached, press process start, finish the work, and then press stop, and the process good quantity and defect quantity are filled with the quantity the sensor counted. After checking, press process complete to save.
Q. How are sensors and scales on a manufacturing site connected to equipment?
Register sensors and scales in Data Collection Device Management. On the equipment registration and edit screen, attach the device to the equipment, and you can set the role of input detection or discharge detection. On the device detail, you view status and detection records.
Q. On the factory dashboard, can inventory, production, and defects be viewed together with targets?
You can view actual results with the dashboard widgets for average inventory amount, production quantity per hour, and process defect rate, set targets, and compare. In the process defect rate widget, you can choose a process and view only that process.
Q. How do you see when a smart scale's weight decreased?
On the smart scale device detail, when you choose a period, the weight change for that period is shown as a graph. When you press a point on the graph, you can find that record right away in the table below.

ⓒ Team Everywhere Inc.